The Value of Energy Efficiency Measures and Solar Power in 2024

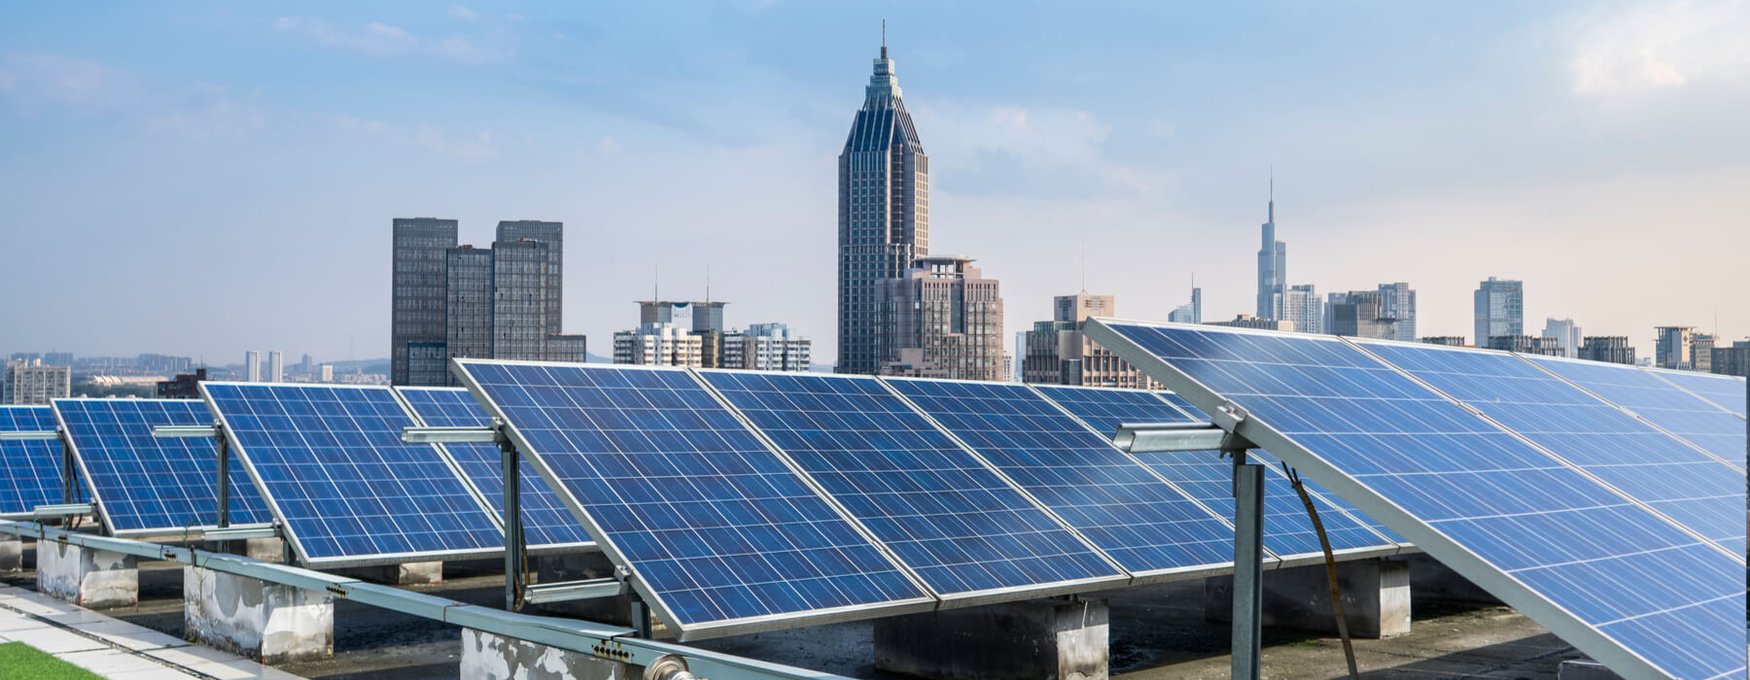
When implementing energy efficiency measures and renewable generation systems, the dollar savings achieved are influenced by local energy costs. For example, 10,000 kilowatt-hours of solar generation will save you $1,000 in a location where electricity is worth 10 cents/kWh, but the savings increase to $2,500 at a price of 25 cents/kWh. The same applies for energy efficiency measures, since the savings measured in cubic feet of gas and kilowatt-hours are multiplied by local tariffs.
The ROI offered by energy efficiency and renewable generation depends on several factors. As you might conclude, the ROI is increased in places with high energy costs. Financial incentives such as rebates and tax exemptions also improve the business case for energy upgrades in buildings. Local laws and regulations are also important; for example, solar panels achieve higher savings when you can export their surplus production to the grid (net metering).
Design and optimal energy upgrade project for your building.
In the case of solar panels, productivity is higher in places with abundant sunshine, but keep in mind that dollar savings also depend on electricity prices. A solar PV system generating 150,000 kWh at 12 cents/kWh will achieve the same savings as an identical system generating 120,000 kWh at 15 cents/kWh. Both systems save $18,000/year in this case, since the higher productivity of the first system is offset by a lower electricity price.
Using Electricity and Natural Gas Price Data from the US EIA

The US Energy Information Administration is an excellent resource when you need to know energy prices by state. This information is valuable when analyzing the potential savings of an energy retrofit or renewable generation project. Here we will provide an example of how to use this information in New York, but you can follow the same procedure for any state.
As a starting point, we will provide the US EIA links where you can compare electricity and gas prices by state:
- Electric Power Monthly - U.S. Energy Information Administration (EIA)
- U.S. Natural Gas Prices (eia.gov)
In the first link, you will find US electricity prices broken down by state and by sector: residential, commercial, industrial, transportation, and average prices across all sectors. In all cases, the electricity price is compared with data from 12 months earlier.
In the second link, natural gas prices are displayed for the entire US by default, and you can choose specific states from the drop-down menu. You can also toggle between annual and monthly periods. Natural gas prices are also broken down by point of use and sector: wellhead, import, export, citygate, residential, commercial, industrial, and gas used for power generation.
Electricity and Gas Prices in NY: A Quick Example

Assume you're considering an energy retrofit for a 100,000 sq.ft. building, which currently uses 2,500,000 kilowatt-hours and 3,000,000 cubic feet of natural gas (3,000 MCF) per year. At the time of writing this blog post, the US EIA reports an electricity price of 17.40 cents/kWh and a natural gas price of $9.77 per MCF (thousand cubic feet) for commercial buildings in New York. Based on this data, the building in our example is currently spending:
- $435,000/year in electricity bills
- $29,310/year in natural gas bills
- $464,310 in total energy bills
Typically, a building retrofit can achieve energy savings of around 30%. Assuming this can be achieved for both electricity and natural gas, the building in our example saves 750,000 kWh and 900 MCF of natural gas per year. This results in the following savings, at current energy prices:
- Electricity savings = 750,000 kWh x $0.1740 per kWh = $130,500 per year
- Natural gas savings = 900 MCF x $9.77 per MCF = $8,793 per year
- Total savings = $139,293 per year
This is based on the data provided by the US EIA for New York state, but you can estimate savings for any other state. For example, New Jersey has an electricity price of 13.05 cents/kWh and a natural gas price of $12.58 per MCF in the commercial sector. Electricity is 25% less expensive than in New York, but gas is almost 29% more expensive, and this is evident when the savings calculation is repeated for NJ:
- Electricity savings = 750,000 kWh x $0.1305 per kWh = $97,875 per year
- Natural gas savings = 900 MCF x $12.58 per MCF = $11,322 per year
- Total savings = $109,197 per year
This is a very simplified analysis, where the goal is showing how building upgrades can have different results depending on your state’s energy prices. A professional energy audit is strongly recommended before making any investment decisions for an actual building.
Energy consultants can also help you qualify for grants, rebates, and other incentives that will drastically reduce your project costs. In some cases, building owners can complete their energy upgrades for $0 upfront thanks to green financing programs, and the resulting savings are higher than the loan payments.

Michael Tobias
Michael Tobias, the Founding Principal of NY Engineers, currently leads a team of 50+ MEP/FP engineers and has led over 1,000 projects in the US
Join 15,000+ Fellow Architects and Contractors
Get expert engineering tips straight to your inbox. Subscribe to the NY Engineers Blog below.


