US EIA: Solar Panel Shipments Reached a New Record in 2021

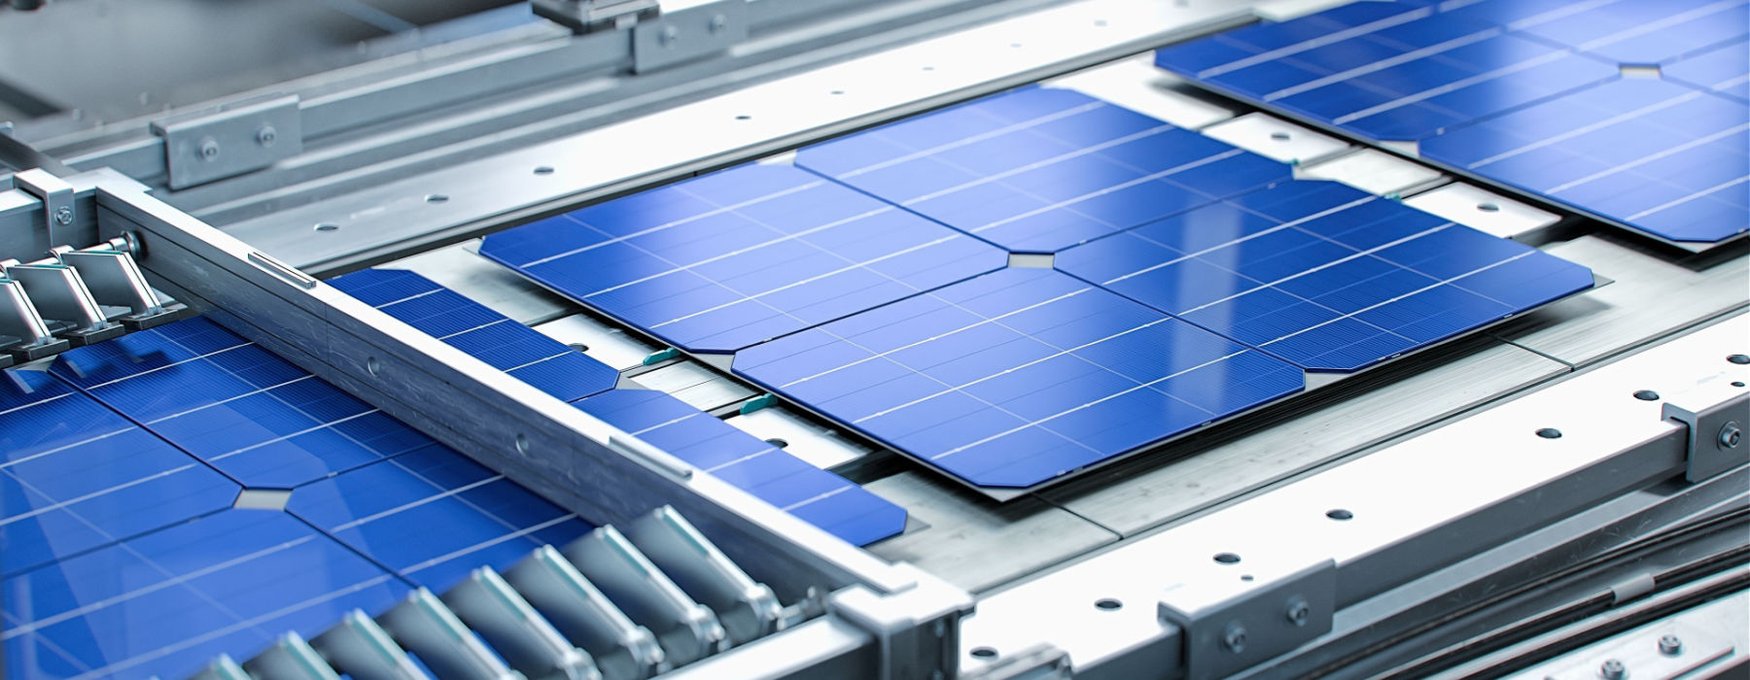
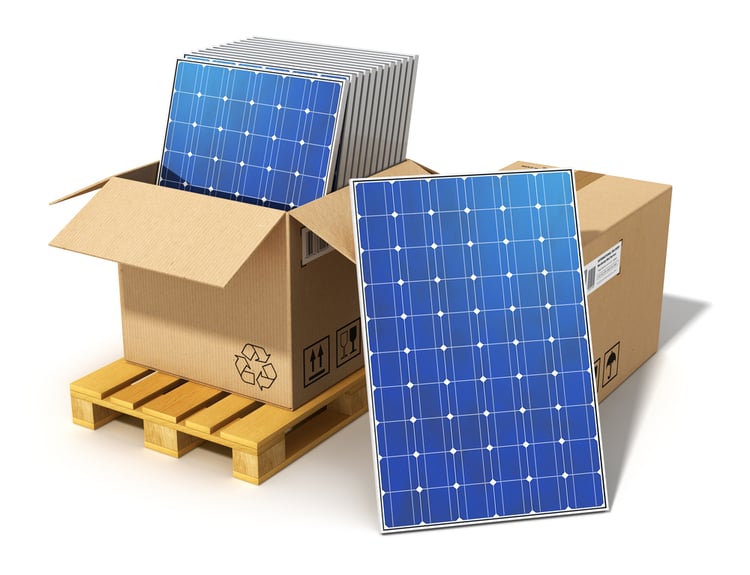
2021 was an excellent year for the US solar industry, with almost 24 gigawatts deployed across all states. This is reflected in the latest solar panel shipment data published by the Energy Information Administration: the US shipped 28.8 million kilowatts of solar panel capacity in 2021, breaking the previous 2020 record of 21.8 million kW. This figure includes imports, exports, and solar panels that are manufactured and used locally.
Get a professional solar PV system design: Save on power bills and cut building emissions.
According to the EIA, imports account for 80% of solar panel shipments in the US, and the main source of imports is Asia. The US solar industry was severely disrupted during the first half of 2022 - the Department of Commerce was investigating import tariff circumvention in southeast Asia, after a petition from a small local manufacturer.
- Under the worst-case scenario, solar imports could be affected by anti-dumping and countervailing duties (AD/CVD) of up to 250%, and these tariffs could be retroactive.
- Solar developers paused or canceled major projects in the US, fearing the cost impact of these new AD/CVD tariffs.
Fortunately, the US government announced that no new tariffs would be applied to solar imports from Cambodia, Malaysia, Thailand and Vietnam during 24 months. Combined with the recent 10-year extension of the 30% federal tax credit, this decision creates certainty for the US solar industry.
Tracking US Solar Panel Shipments Between 2010 and 2021

According to the data gathered by the EIA, the volume of US solar panels shipments increased by more than 1000% between 2010 and 2021:
- 2,644,498 kW of capacity in 2010
- 28,838,343 kW of capacity in 2021
The US surpassed 10 GW of solar panel shipments for the first time in 2016, and the 20 GW mark was exceeded in 2020.
As the PV shipment volume has increased, the value per watt has been decreasing sharply, making solar power more affordable. The value of PV modules was $3.50 per watt in 2006, when the US EIA started tracking data. This figure had dropped to $1.96 per watt in 2010 and only $0.34 per watt in 2021.
There were six states who surpassed 1 GW of solar panel shipments in 2021:
- California: 5,093,259 kW
- Florida: 1,739,378 kW
- Georgia: 1,147,733 kW
- Illinois: 1,120,581 kW
- Nevada: 1,056,625 kW
- Texas: 4,305,215 kW
Together, these six states accumulated over 14.4 GW of solar shipments in 2021, which represents half of the total volume reported by the US EIA.
Between 2020 and 2021, the US solar shipment volume increased from 21.8 million to 28.8 million kW (+32%). The value per watt decreased from $0.38 to $0.34 (-10.5%) in spite of supply chain issues and inflation.
How the Inflation Reduction Act Benefits Local Solar Manufacturing
Imports currently represent 80% of solar shipments in the US, but this could start to change with the tax benefits introduced by the Inflation Reduction Act (IRA). The previous version of the federal tax credit was only available for end users - homeowners and businesses who installed solar panels. There is a now a federal tax credit for domestic solar manufacturers who meet certain requirements, and they can choose between the following options:
- Investment Tax Credit: Claiming a 30% federal tax credit for eligible investments in solar manufacturing capacity.
- Production Tax Credit: Getting a small tax credit per product, available for solar panels and other photovoltaic system components.
The following table summarizes the production tax credits available when the Inflation Reduction Act came into effect in August 2022, and they will be updated each year:
|
Solar Component Category |
Eligible Products |
ProductionTax Credit |
|
Solar cells and modules |
Photovoltaic modules Thin-film PV cells Crystalline silicon PV cells Crystalline silicon PV wafers Solar grade polysilicon Polymer backsheets |
7 ¢ / Wdc 5 ¢ / Wdc 4 ¢ / Wdc $12 / m2 $3 / kg $0.40 / m2 |
|
Inverters |
Central inverter Utility inverter Commercial inverter Residential inverter Microinverter |
0.25 ¢ / Wac 1.50 ¢ / Wac 2.00 ¢ / Wac 6.50 ¢ / Wac 11.00 ¢ / Wac |
|
Tracking systems |
Torque tube or longitudinal purlin Structural fasteners |
$0.87 / kg $2.28 / kg |
|
Batteries |
Electrode active materials Cells Modules Modules that don’t use cells Critical materials |
10% $35 / kWh $10 / kWh $45 / kWh 10% |
The Inflation Reduction Act established a $10 billion tax credit budget for US-based solar manufacturers. This incentive can help reduce the cost of local solar component production, increasing the domestic percentage of shipments.

Michael Tobias
Michael Tobias, the Founding Principal of NY Engineers, currently leads a team of 50+ MEP/FP engineers and has led over 1,000 projects in the US
Join 15,000+ Fellow Architects and Contractors
Get expert engineering tips straight to your inbox. Subscribe to the NY Engineers Blog below.


